Data Analysis
This tool automates processed data (training dataset) analysis and relation to the target variable. The report is generated during model training for each solution. Given the potentially wide feature space, up to 20 of the most important features with the highest statistical significance are selected for data analysis based on machine learning modeling. The data analysis tool is available on the “My Solution” page and the “Results” tab, found via the “Data Analysis” button.
The final model might indicate a slightly different set of features having the highest importance due to a comprehensive number of iterations during training. This could result in discrepancies between the features selected for data analysis and the final Feature Importance Matrix.
![]()
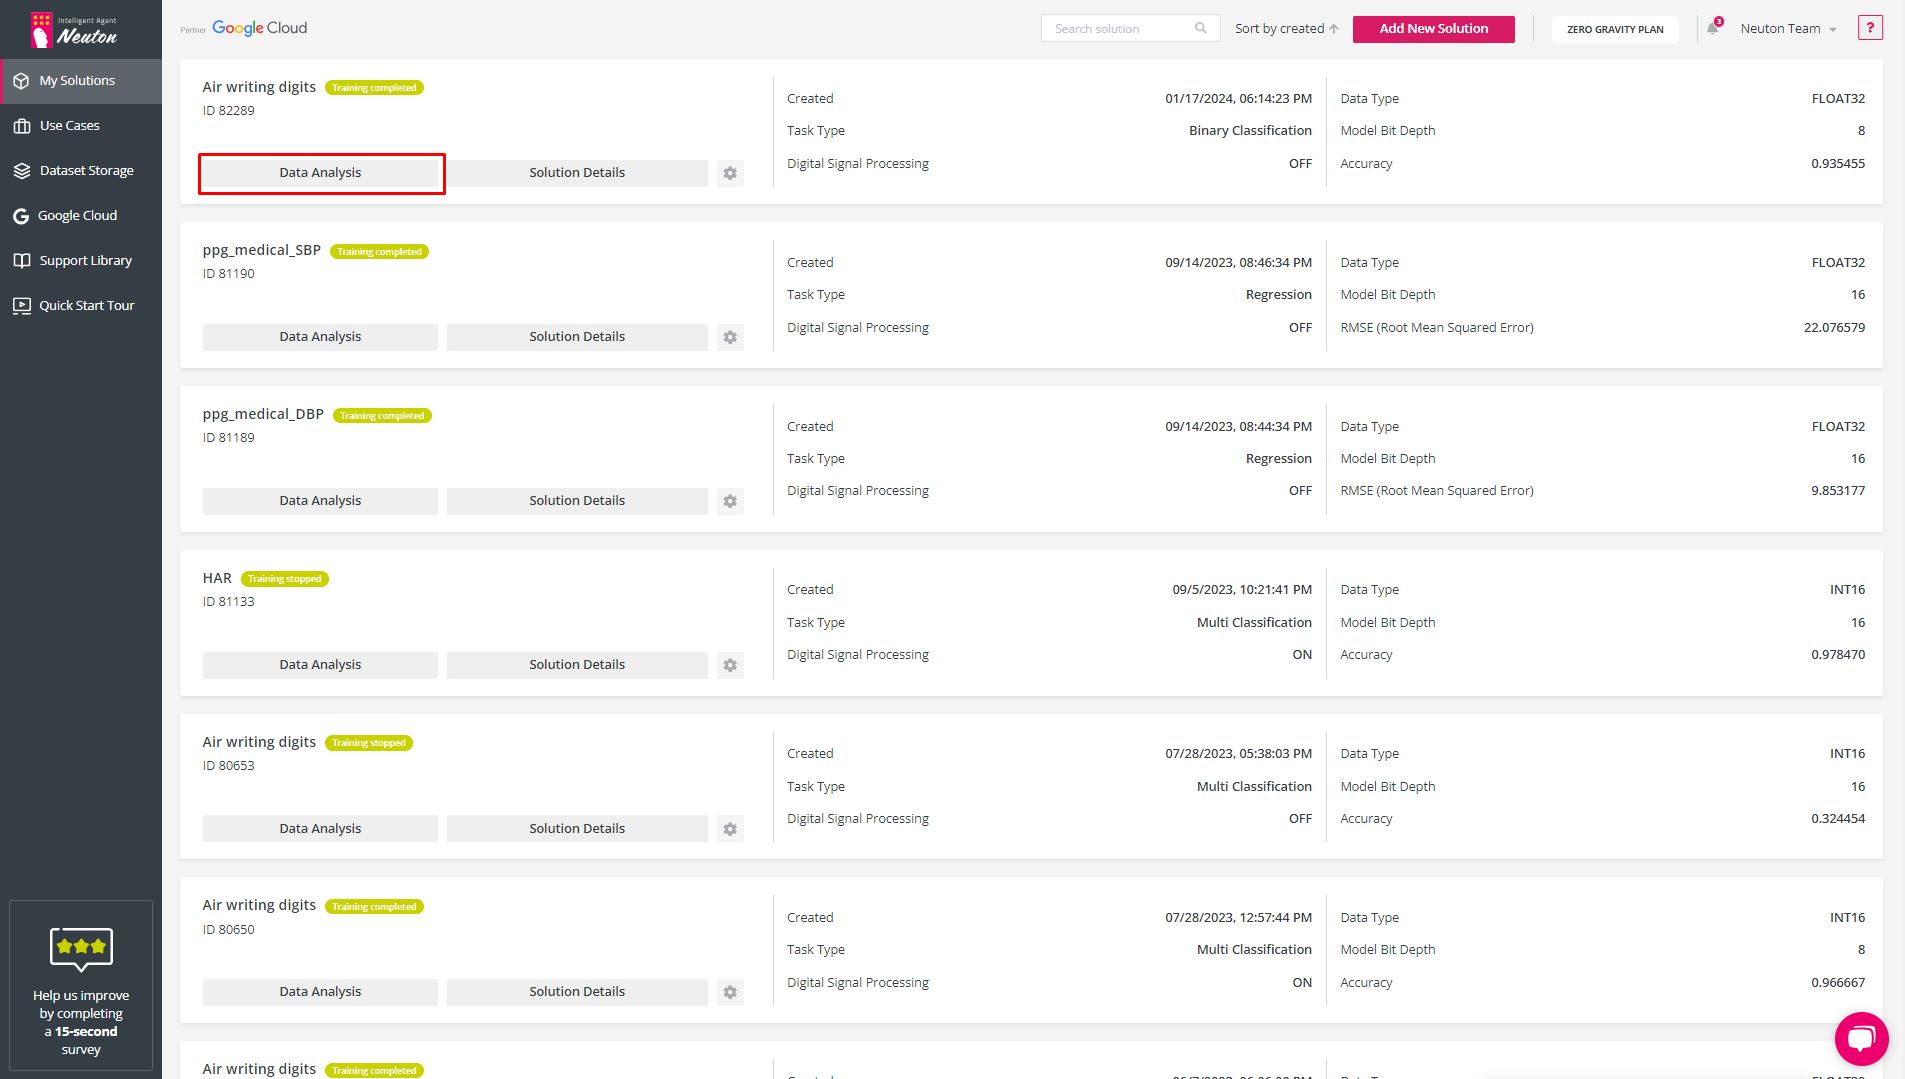
My Solutions. Data Analysis
![]()
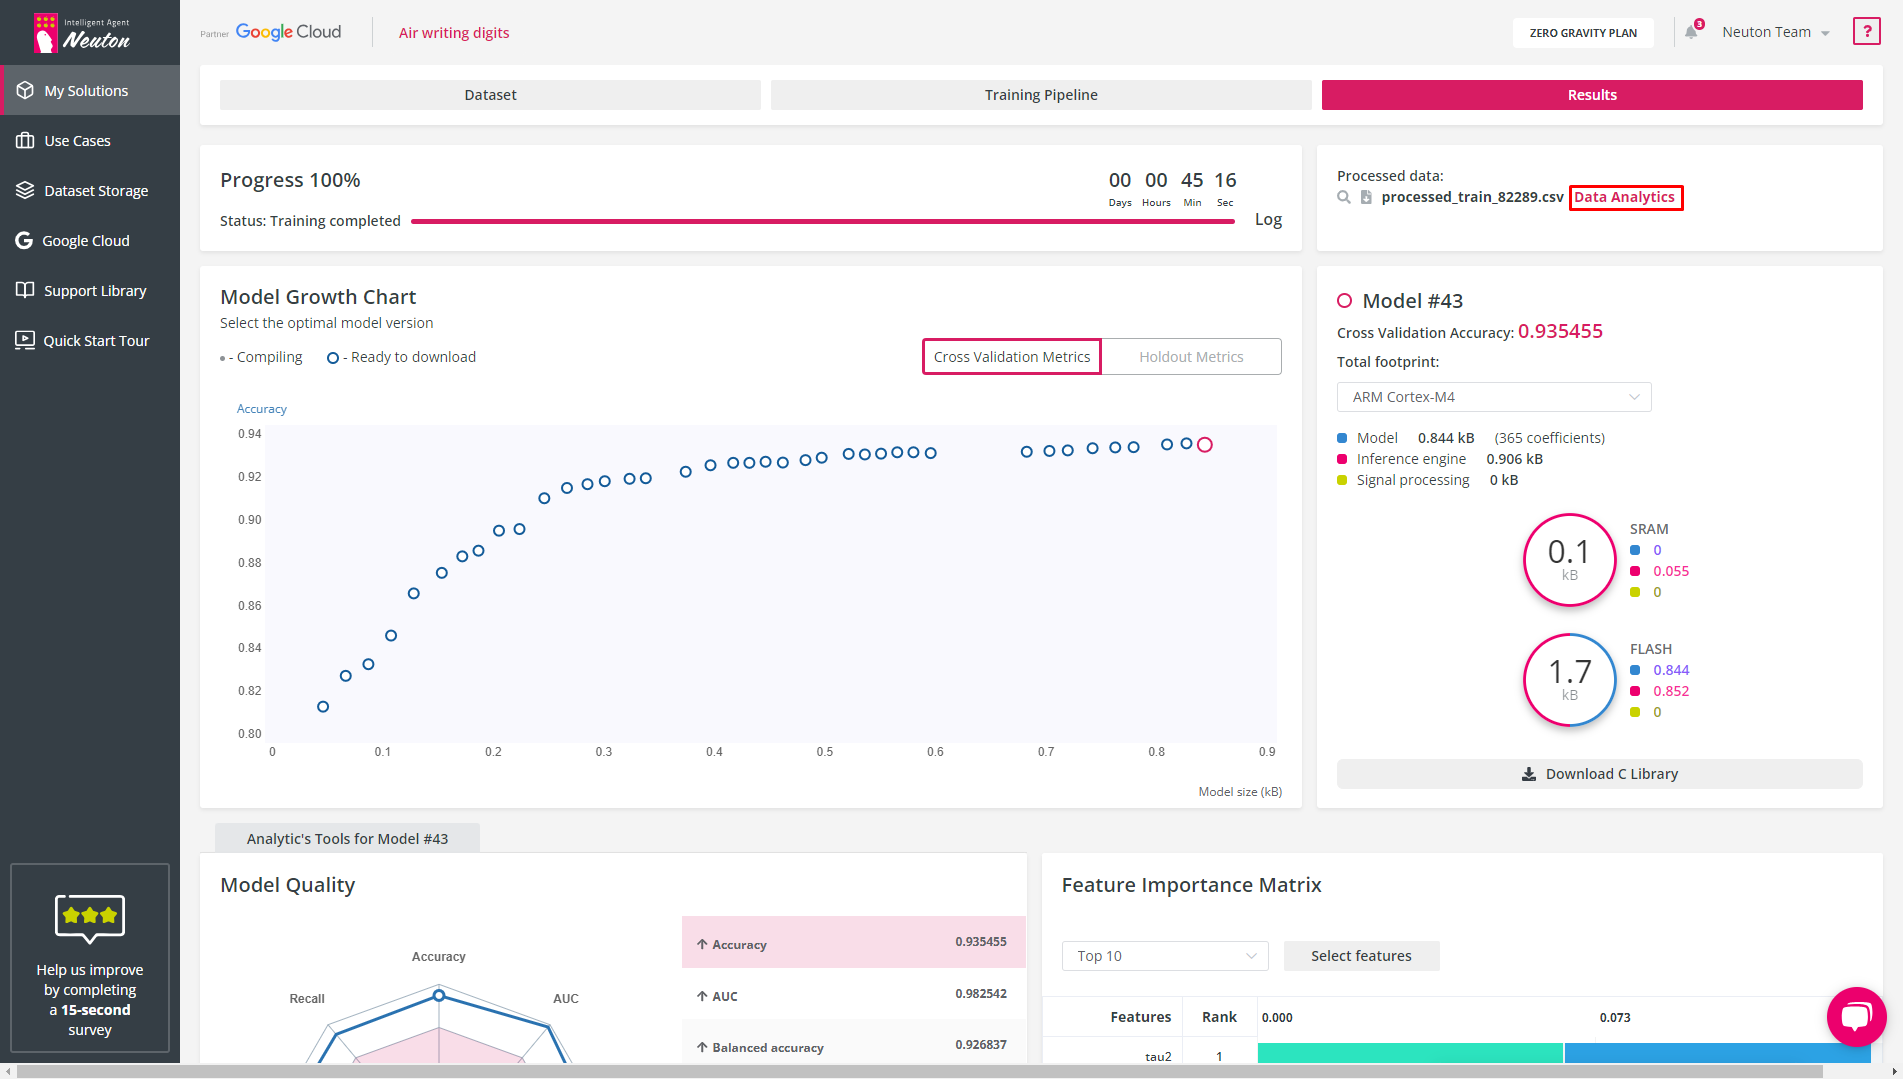
Results. Data Analysis
In the “Data Analysis” tool you can find the specified information on graphics in each of the following sections:
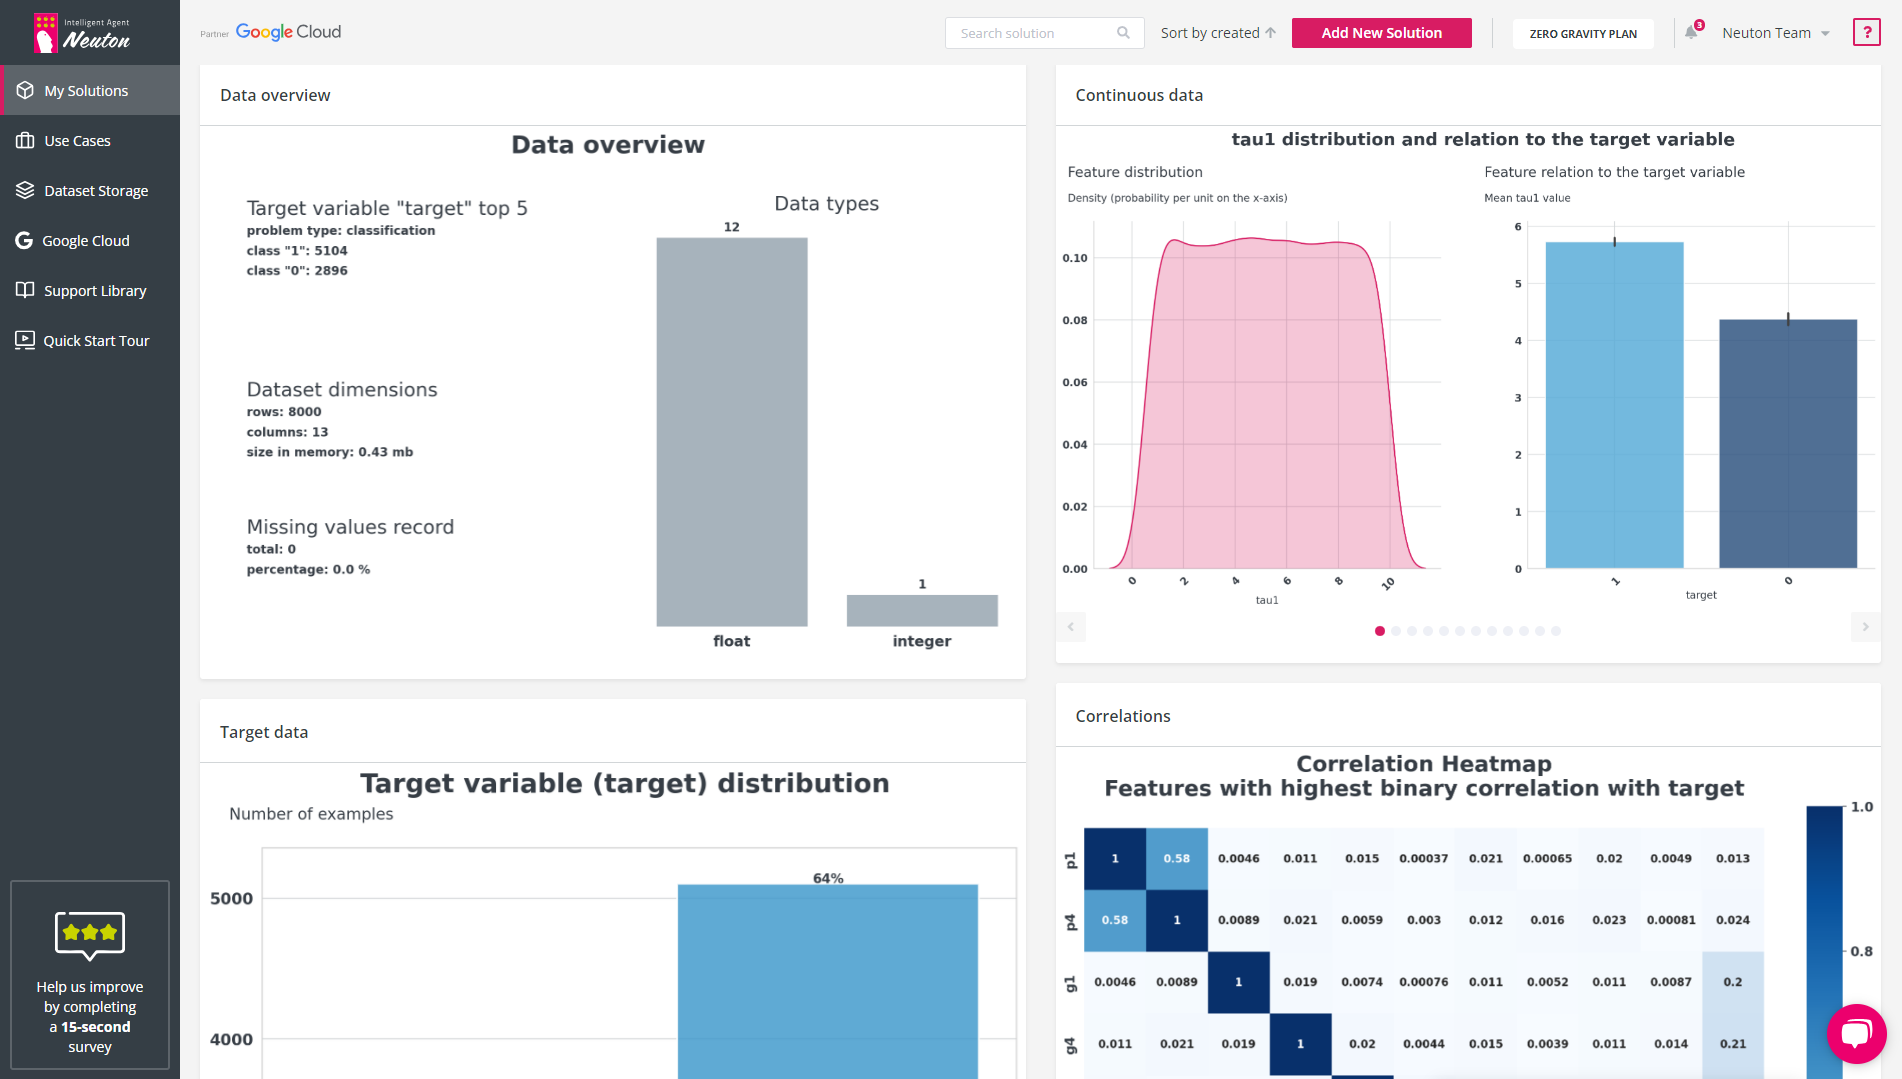
Dataset overview
This section displays brief data statistics of your training dataset and provides the following information: problem type, dataset dimension, missing values, and record number.
Continuous data distribution and relation to the target variable.
Visualization of each continuous variable yields two plots:
Variable density distribution chart
A Density plot visualizes the distribution of data across all rows in the dataset. This chart is a variation of a histogram that uses kernel smoothing to plot values, allowing smoother distributions by smoothing out the noise. The peaks of a Density plot help to display where values are concentrated over the interval.
Feature relation to the target variable (different for regression and classification task types)
This chart is presented in one of the following two formats: line chart, indicating the continuous variable changes with the changes in the continuous target variable (regression task type), or histogram, showing the mean continuous variable value for each of the classes of the target variable (classification task type).
Feature correlations
Visualization of the correlations in the data yields two plots:
Heatmap displaying the binary correlation of the 10 most important variables between each other and with the target variable (the 10 most important features are selected based on the binary correlation of the features with the target variable);
Histogram (horizontal) displaying the level of high mutual correlation between independent variable pairs.
Pairs are selected if the value of their mutual correlation exceeds 0.7.
Target variable distribution
Visualization of the target variable statistics is presented in one of the two formats:
Violin plot displaying the distribution, median, and outliers in the target variable (regression task type);
Histogram/count plot displaying the number and percentage of each of the target classes throughout the whole dataset (classification task type)
Outliers
Visualization of the outliers in the data is presented in one of the two plots:
Scatter plot displaying the variable distribution in relation to the target variable (regression task type);
![]()
Results. Data Analysis
Model Quality Diagram
The Model Quality Diagram simplifies the process of evaluating the model quality. The values of all metrics are evaluated on a scale from 0 to 1, where 1 is the most accurate model.
![]()
Model Quality Diagram
It also allows users to understand metric balance for the selected model. When the figure displayed is close to the shape of a regular polygon, that conveys a perfect balance between all metric indicator values.
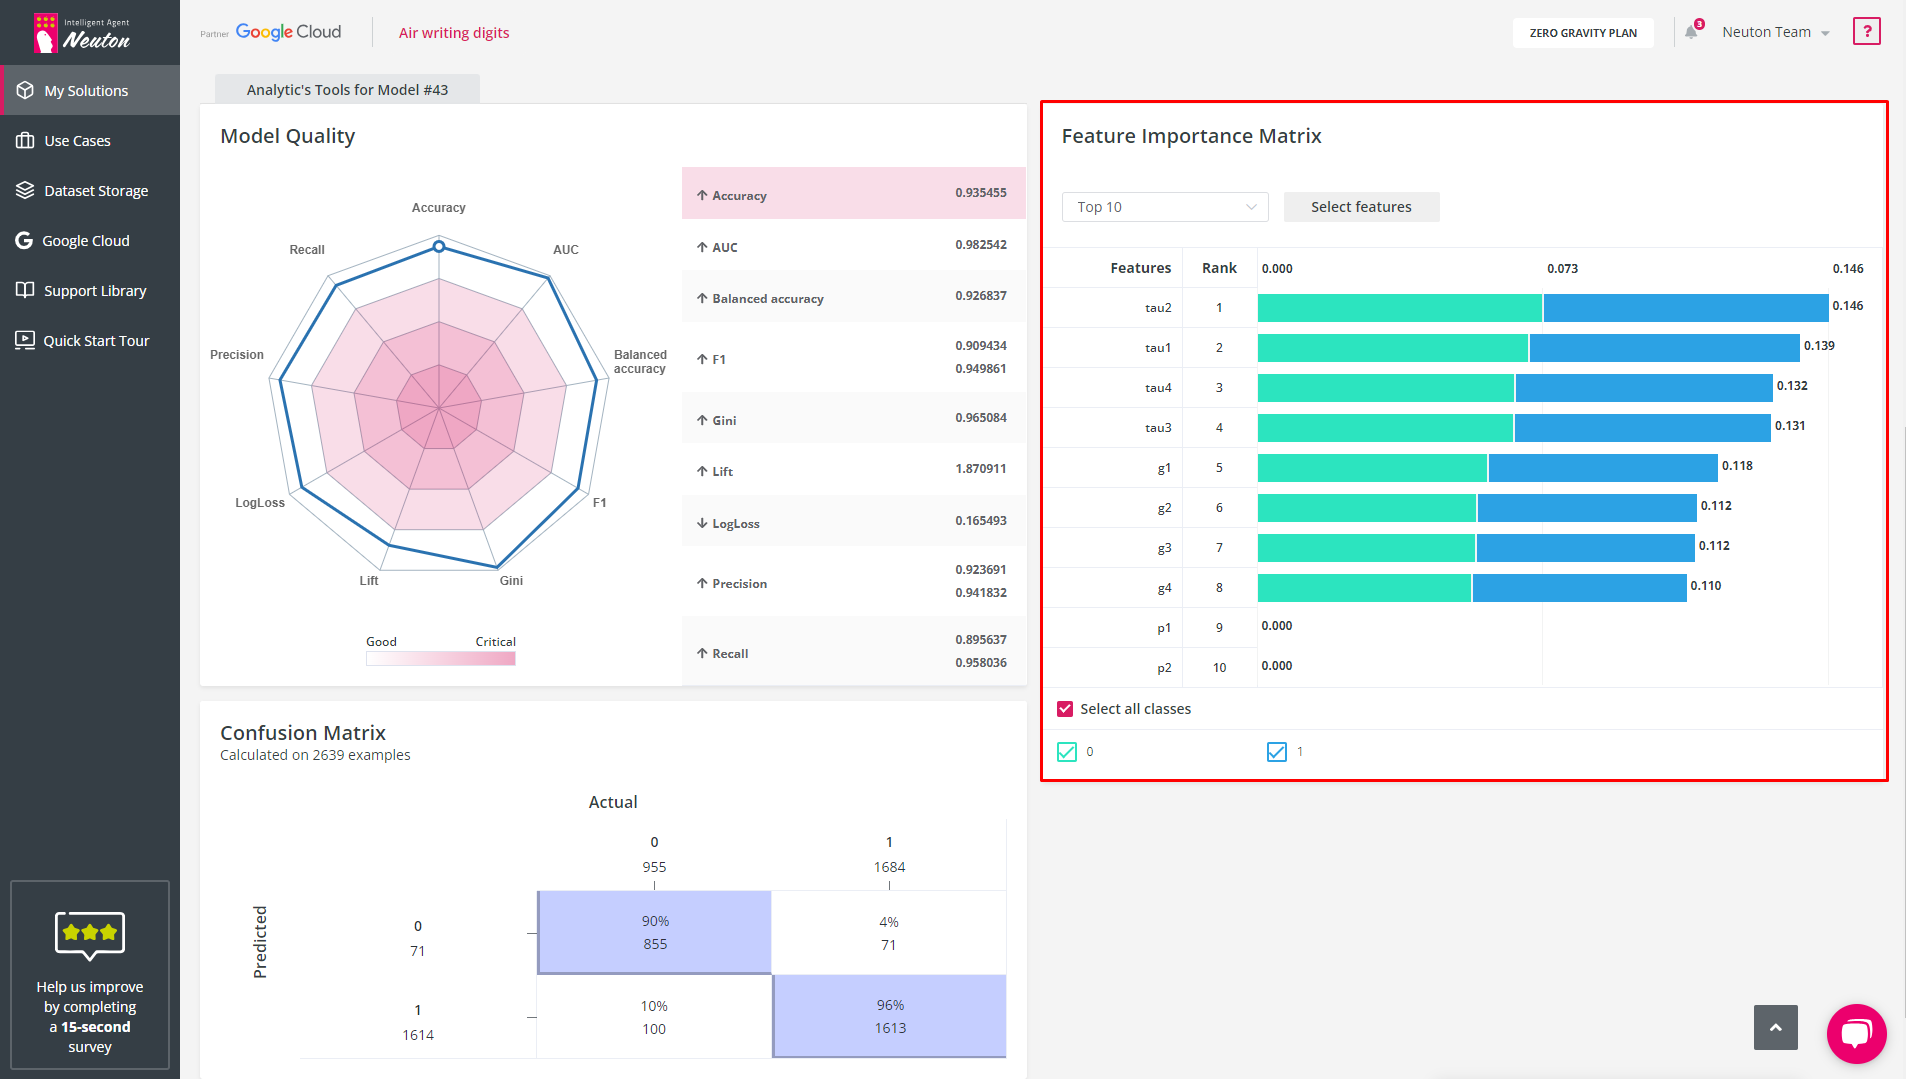
Feature Importance Matrix (FIM)
After the model has been trained, the platform displays a chart with the 10 features that had the most significant impact on the model prediction of the target variable (for the selected model). The chart can be found in the Results tab.
The Feature Importance Matrix helps to evaluate the impact of features on the model.
If the feature does not affect the model at all (normalized value = 0), then you can exclude this variable from building the model.
![]()
Feature Importance Matrix
FIM has the following control options:
Top 10/Bottom 10
This control option allows you to show the 10 most important or least important features.
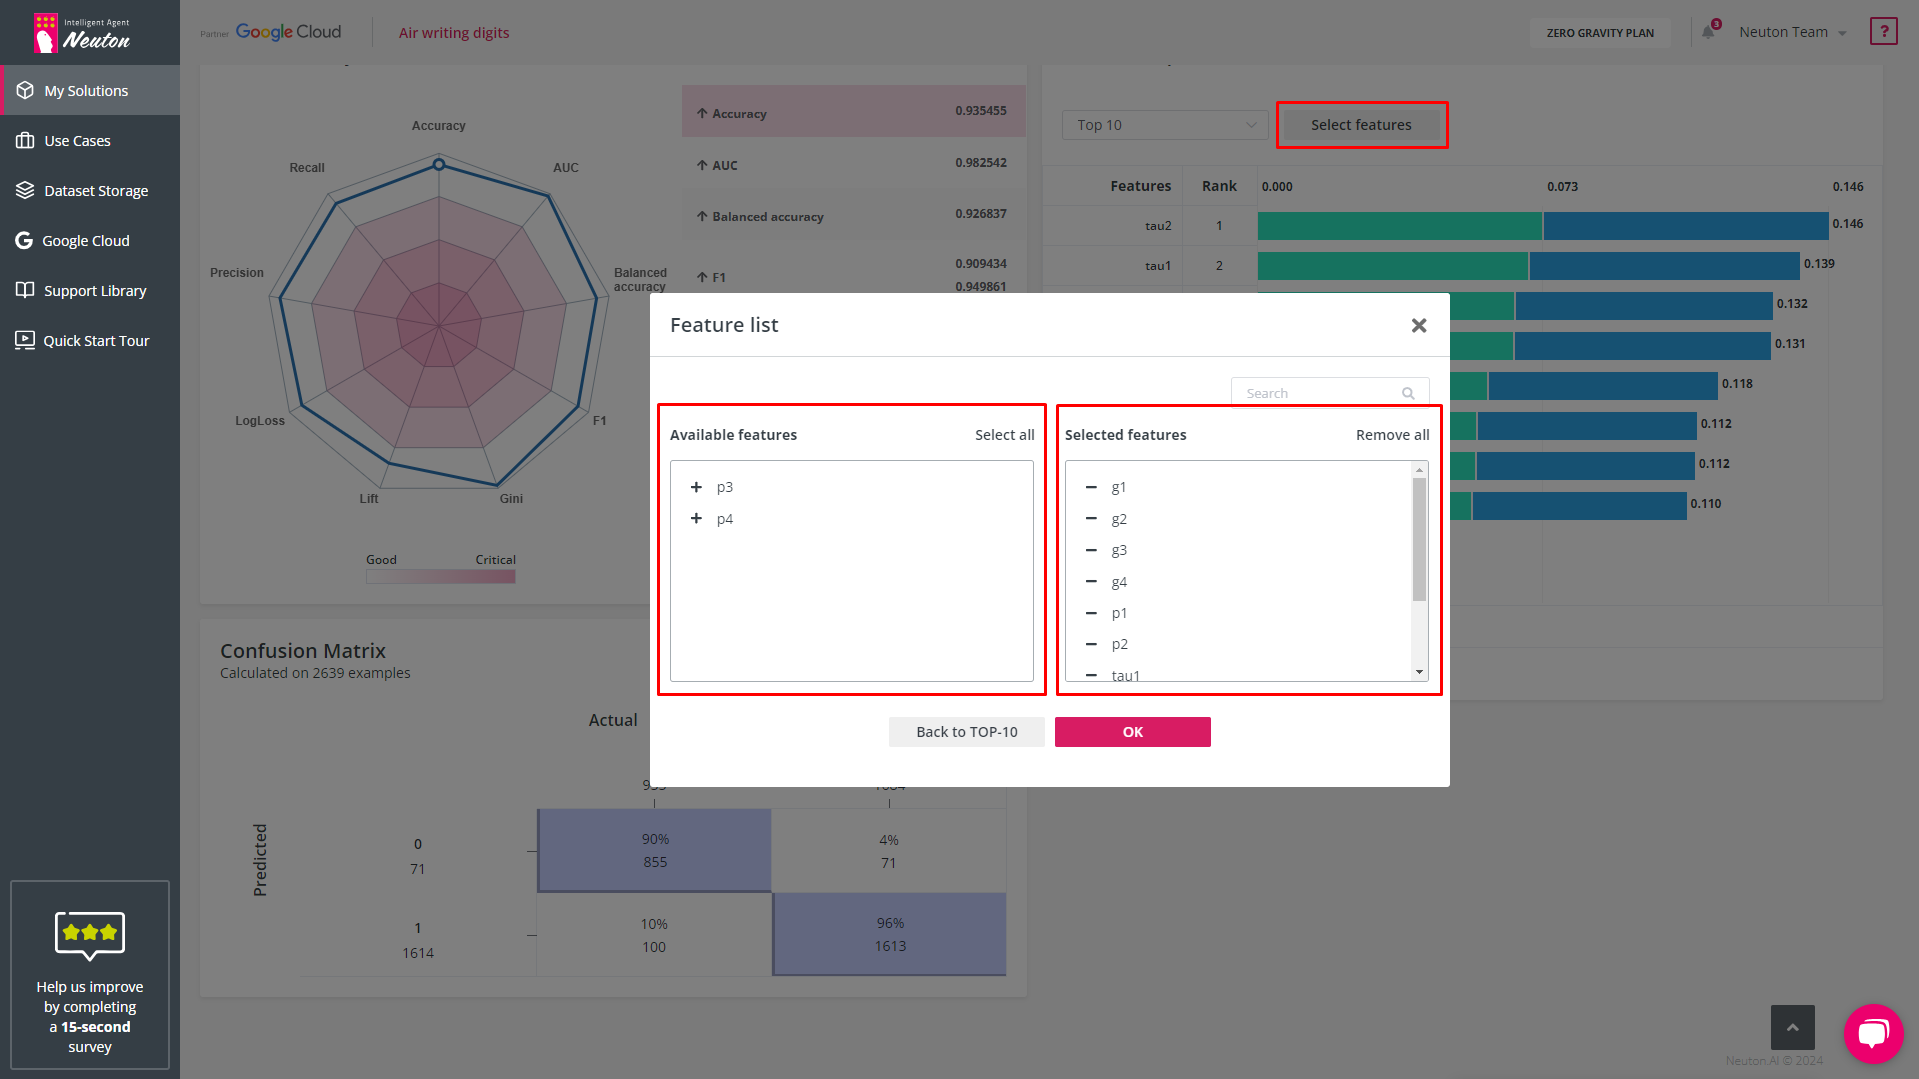
Select features
The “Select Features” button allows you to select/remove features of interest.
Classes (for binary and multiclass classification task types only)
These check boxes allow you to control what classes to display on a bar chart.
![]()
Feature Importance Matrix. Feature List
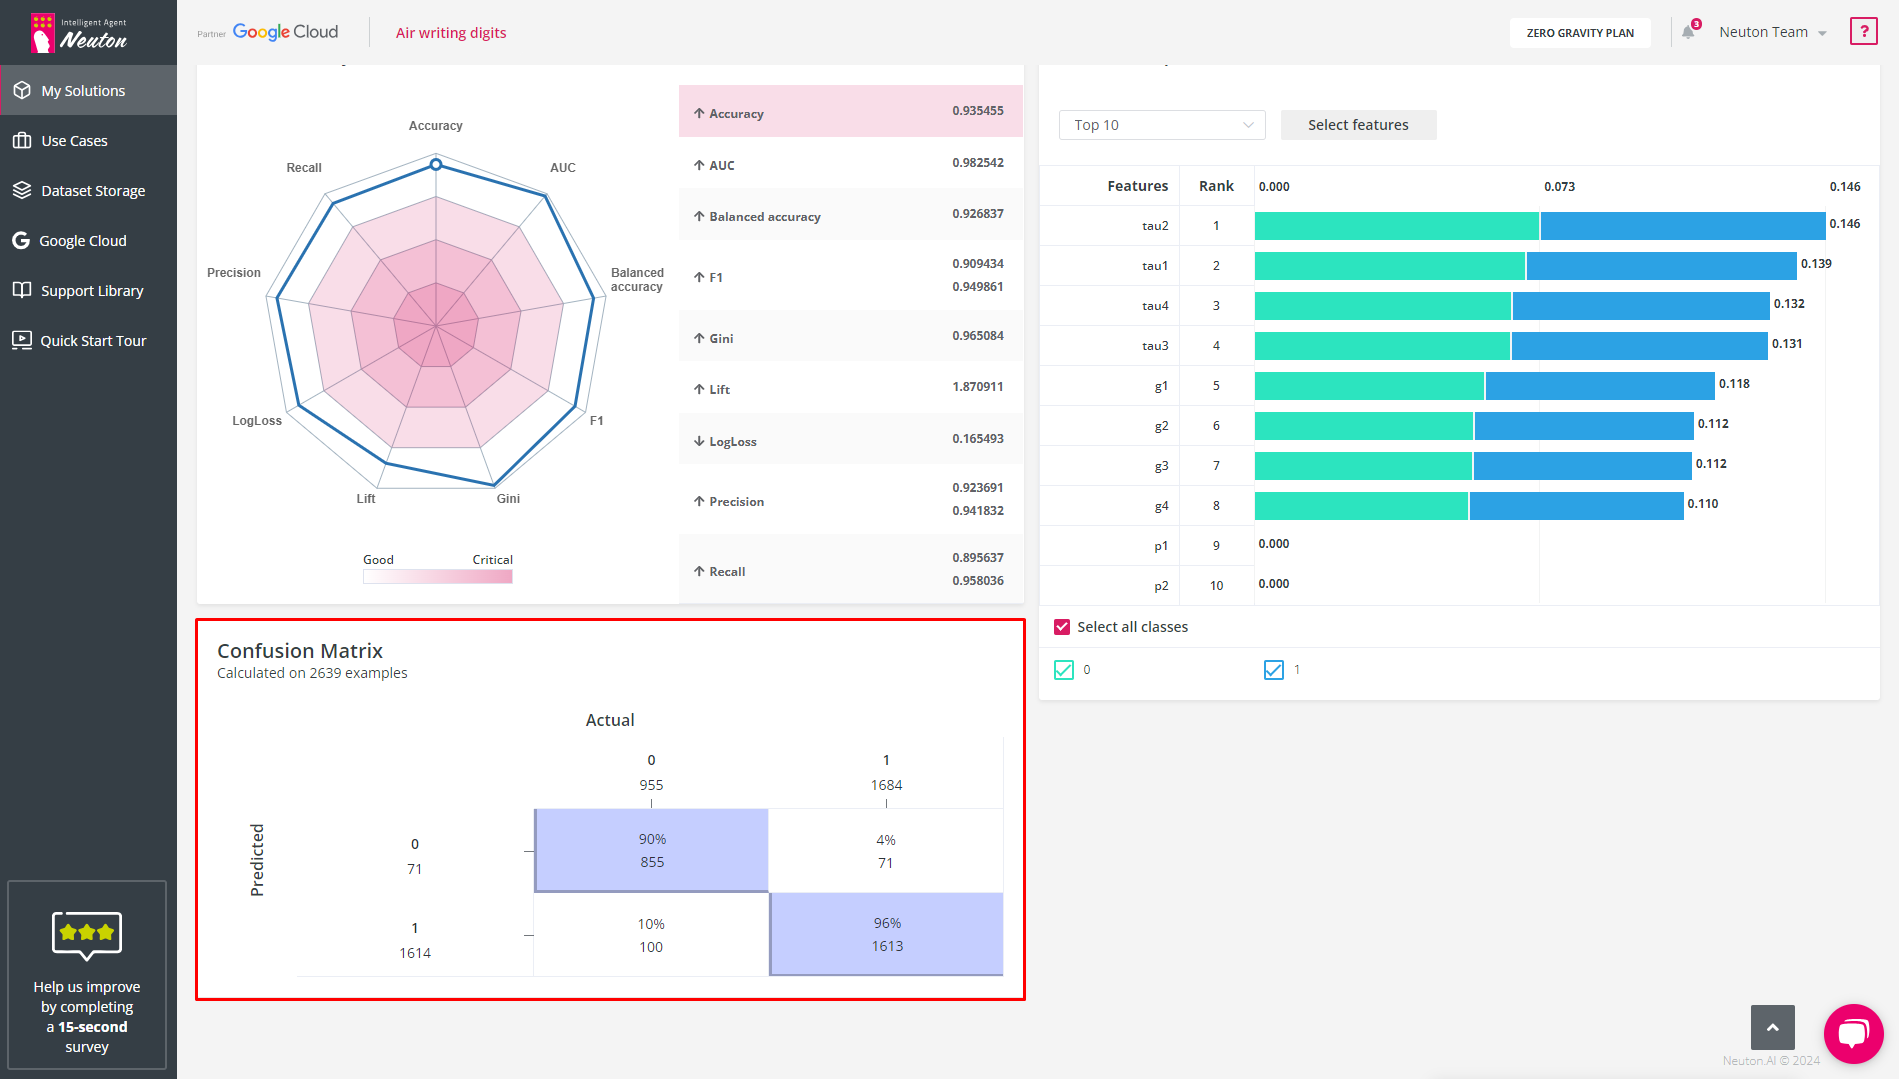
Confusion Matrix (for classification tasks only)
The Confusion Matrix shows the number of correct and incorrect predictions based on the validation data for the selected model.
![]()
Confusion Matrix
You can find it in the Results tab in each solution with a classification problem.