To understand the logic of the way in which variables change throughout the space, the tool displays
class boundaries for classification problems, and graphics for regression problems. This enables one
to
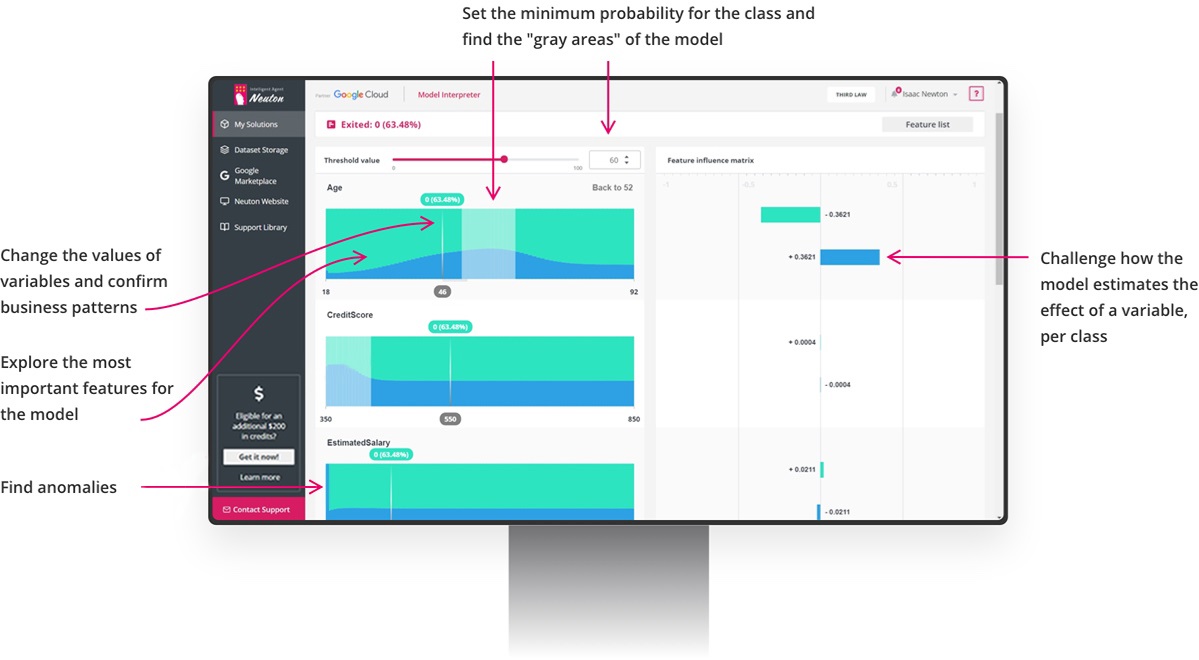
see, without even changing the input variables, the "train of thought" of the model in one image.
To understand the strength of the influence of each variable on the target variable, we calculate the importance scores. For classification problems, the tool shows feature effects on each class. To understand the direction of changes, these scores are displayed on the graph, negative values for which indicate an inverse relationship.
Based on the sensitivity coefficients, a ranking of the most important parameters in relation to the target variable is formed. For classification problems, the importance of factors is divided into classes.

Use Cases
In the data-driven world, predictive churn management is a trending topic full of new possibilities.
Effective churn prevention based on data mining and machine learning is typically dependent on a
tremendous amount of existing data as well as new data.
Regression task = Property valuation.
Binary classification = Credit scoring (to approve or not approve a loan).
Hypothesis testing
Test your hypothesis with the Model Interpreter.
Example Hypothesis: «The price of the house will increase by 10% after refurbishment.»
Current predicted price = $150,000.
New predicted price (after having changed the value of the ‘refurbishment’ column to ‘yes’) = $151,400. The scale of price decrease of the house is less than 1%.
The hypothesis has failed.
Min/max target variable
Explore the factors guiding the prediction value toward their minimum or maximum.
Example:
Current predicted price = $150,000.
Min price = $132,000 (for example, if the age of the house increased by 10 years)
Max price = $163,000 (for example, if the house included a garage)
Example:
Current predicted price = $150,000.
Min price = $132,000 (for example, if the age of the house increased by 10 years)
Max price = $163,000 (for example, if the house included a garage)
Search for patterns
Change the factors and discover new patterns.
Example:
For the elite class of housing, the lower the building height - the higher the housing price.
For the business and economy classes, this factor has the opposite impact, by decreasing the housing value.
Example:
For the elite class of housing, the lower the building height - the higher the housing price.
For the business and economy classes, this factor has the opposite impact, by decreasing the housing value.
Rank by importance
The factors that are important to the overall model are not always important for a specific
prediction.
Identify the most important factors for each prediction and use them in your decision-making
process.
Example:
The criminality of a district is among the TOP-5 most important factors influencing the real estate appraisal model. However, for the apartment located in a downtown elite area, the criminality factor is in 24th place (very low).
Example:
The criminality of a district is among the TOP-5 most important factors influencing the real estate appraisal model. However, for the apartment located in a downtown elite area, the criminality factor is in 24th place (very low).
Threshold value
Set the threshold for the target variable, and easily examine the conditions (factors values) which
lead
the prediction to be lower / higher than the threshold.
Example:
You are interested in housing cheaper than $150,000. The predicted price will meet this condition if:
Example:
You are interested in housing cheaper than $150,000. The predicted price will meet this condition if:
distance from the city center > 15 miles,
total area is less than 1000 sq ft,
building age > 5 years.
Model validation
Examine the model from various perspectives:
Change the factors and see if the model supports business logic.
Example:
Case #1. Apartment predicted price increases if the size of the apartment increases. The model worked correctly.
Case #2. The smaller the distance to the city center - the cheaper the house. This may be a normal dependence (the ecology in the center is worse) or an incorrect model operation.
Case #1. Apartment predicted price increases if the size of the apartment increases. The model worked correctly.
Case #2. The smaller the distance to the city center - the cheaper the house. This may be a normal dependence (the ecology in the center is worse) or an incorrect model operation.
Example:
Validation the apartment-pricing model.
Validation the apartment-pricing model.
| Model prediction | Actual value of sale | Error |
|---|---|---|
| $161,290 | $160,100 | 0.0080 |
| $170,000 | $170,000 | 0.0000 |
| $168,690 | $170,600 | 0.0113 |
The error is less than 1%, validating that the model works correctly.